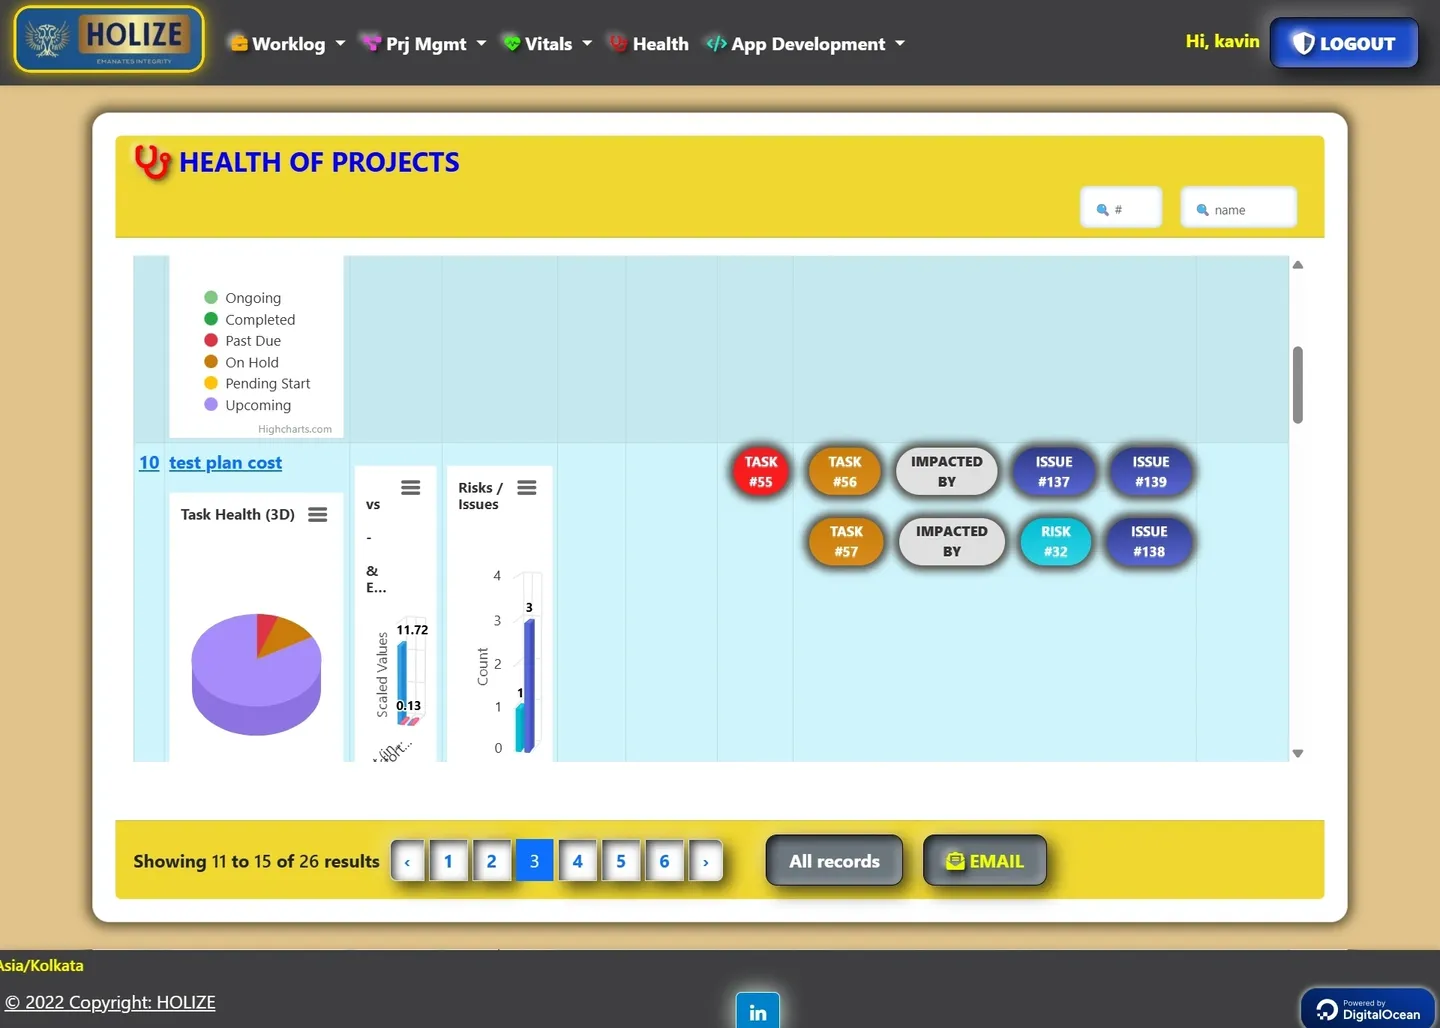
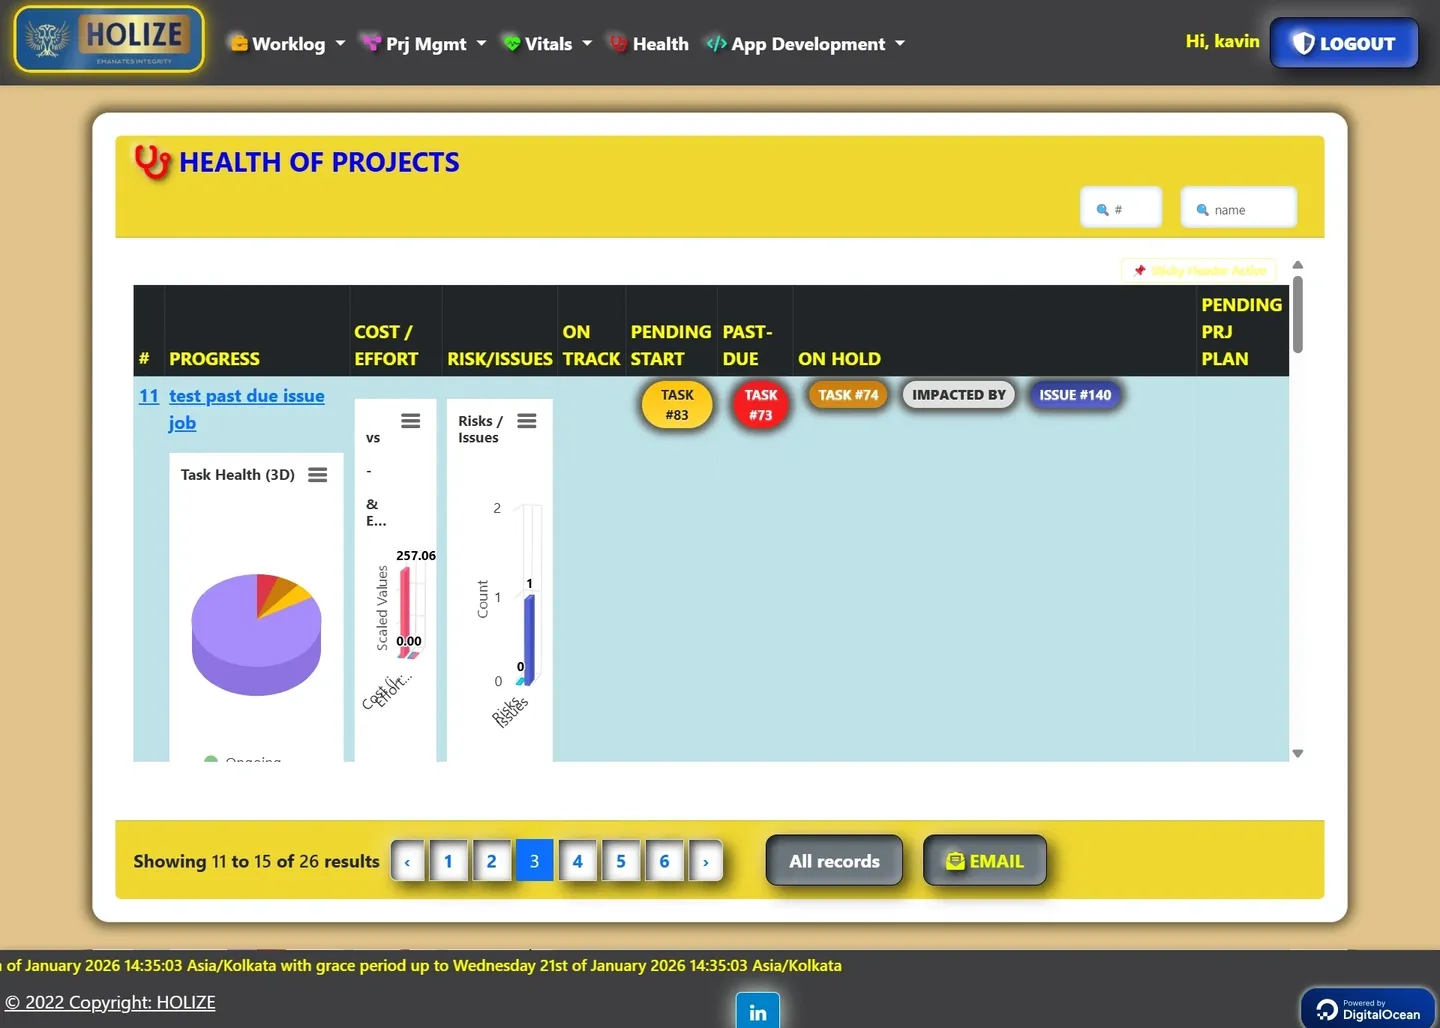
Track project status, cost, and risk/issue exposure across all projects instantly.
👤 Who Can Access
▫️ Everyone in the organization can access the Health Dashboard — including Admins, PMs, Team Leads, and Team Members
📥 Input
▫️ Status of tasks from each 📋 Project Plan
▫️ Risk, Issue, and Action Item counts
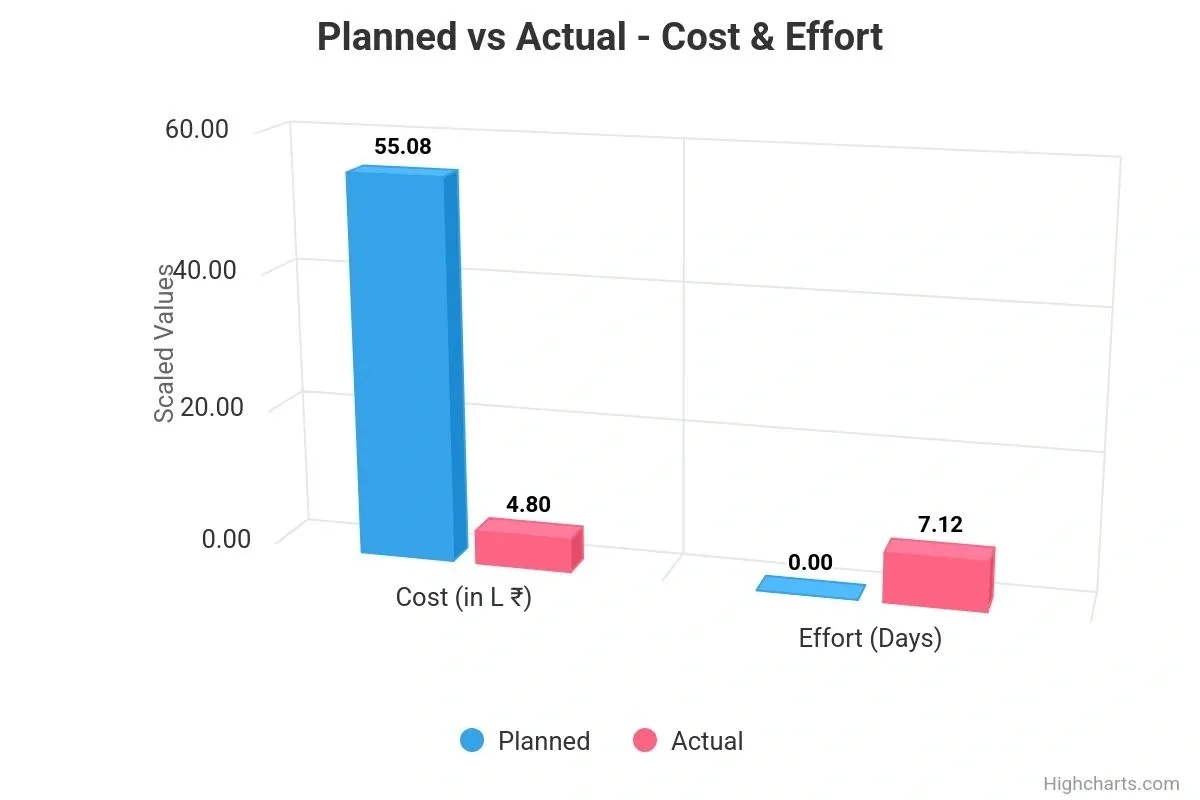
▫️ Planned vs Actual Cost and Effort
▫️ Checkpoint pass/fail counts (if applicable)
📤 Output
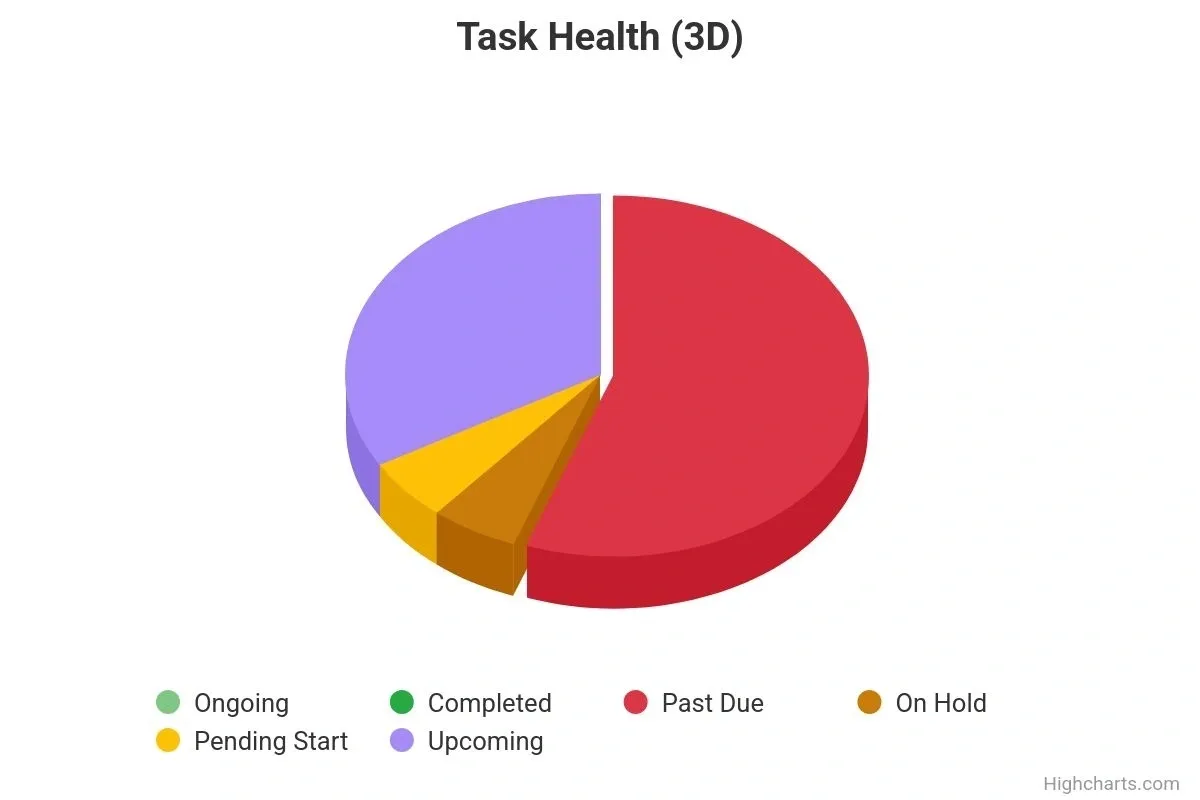
▫️ Color-coded task distribution:
▫️ 🟢 On Track
▫️ 🟡 Upcoming
▫️ 🔴 Past Due
▫️ 🟠 On Hold
▫️ ⚪ Pending Start
▫️ 🟣 Completed
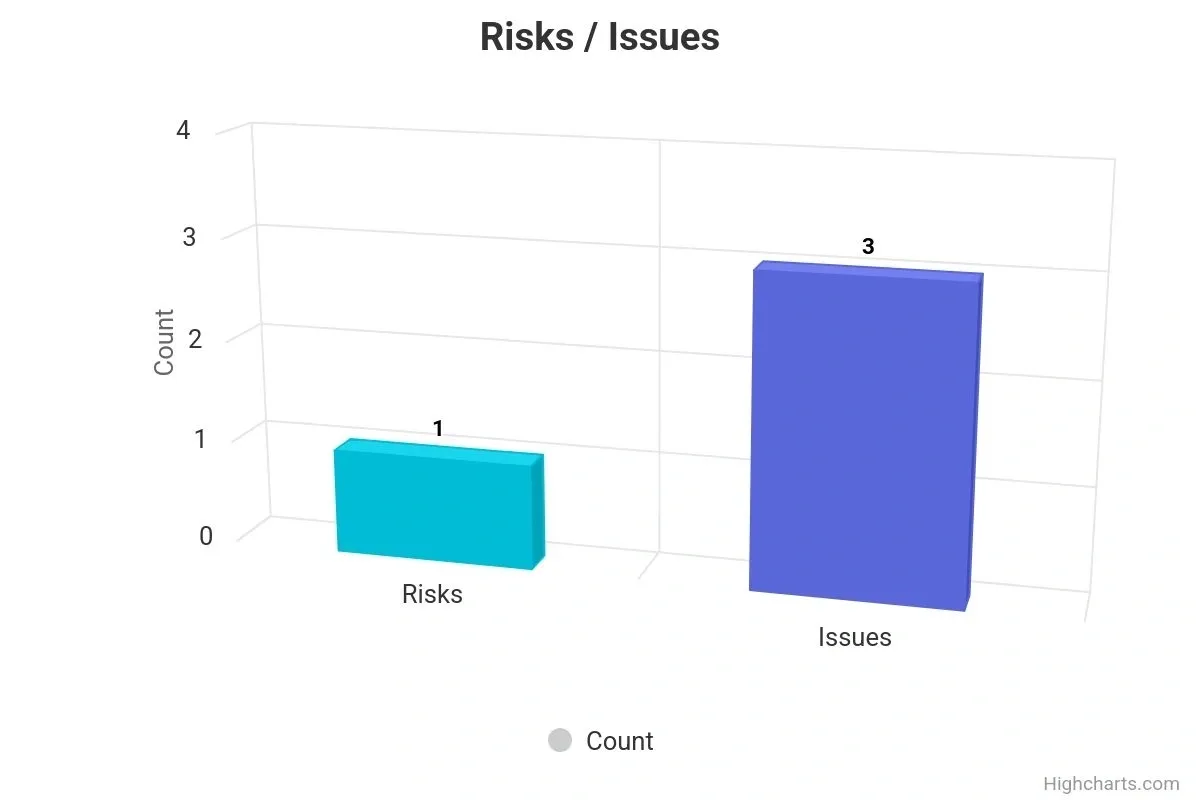
▫️ 3D RIA Chart with counts of:
▫️ Risks
▫️ Issues
▫️ Action Items
▫️ Pie chart of task statuses
▫️ Bar chart comparing:
▫️ 💰 Planned vs Actual Cost
▫️ 🕒 Planned vs Actual Effort
▫️ Auto-generated visuals updated daily
🧾 Pre-requisites
▫️ At least one project with a valid 📋 Project Plan
▫️ Tasks must have start and end dates
▫️ Risks, issues, or action items
▫️ Checkpoints configured
🔗 Dependents
▫️ Leadership Monitoring: quick decision-making from a single glance
▫️ Audit Trails: charts built on live system data for accountability
Experience HOLIZE – The Future of Project Execution Automation! 🚀
Your dedicated HOLIZE instance, will be automatically stood-up and login credentials will be sent to your email-id. No commitment required!
Sign Up for Free Trial